Lead Scoring: How Businesses Decide Which Prospects Need Attention First
Most growing businesses hit the same wall. Leads pour in from paid ads, organic traffic, events, referrals, and social media engagement, and lead scoring—whether you’re prioritizing U.S. demand from SEMrush-driven acquisition or other channels—is the method for ranking those leads by fit and intent so sales knows who to contact first. For sales leaders, marketing teams, and business decision-makers managing high-volume U.S. pipelines, that means faster response times, better sales-and-marketing alignment, and more conversions without adding headcount.
The pipeline looks healthy on paper, but the sales team can only make so many calls per day, and not every lead deserves the same level of urgency. This guide explains the fundamentals of lead scoring, how to build and test a scoring model, which data inputs to use, how to separate fit from intent, when to automate, which pitfalls to avoid, and what that looks like in practical U.S. demand examples.
Why Lead Scoring Matters When Your Pipeline Starts To Overflow
When leads arrive faster than reps can follow up, three things break down. First, response times stretch. A prospect who requested a demo on Monday might not hear back until Thursday, by which point they have already booked a call with a competitor. Second, reps start cherry-picking. Without a clear system, salespeople default to gut instinct, pursuing leads that "feel" right while ignoring others that may convert at a higher rate. Third, marketing loses visibility into what happens after handoff, making it nearly impossible to measure which campaigns produced revenue and which just produced noise.
Sales reps spend roughly 8% of their time prioritizing leads and opportunities. That number climbs when there is no scoring system and reps have to manually sort through CRM records, a time-consuming process, to decide who deserves a call. Lead scoring improves the likelihood of closing deals by timely follow-ups, because the highest-intent prospects get reached while their interest is still fresh.
Lead scoring is a systematic way to rank prospects so the sales team knows who to call, when, and with what urgency. Prospects receive points based on explicit and implicit data. The result is a prioritized list that replaces guesswork with a repeatable scoring model tied to actual revenue outcomes.
The business value is straightforward: faster response times for the right people, more deals without adding headcount, and a clearer handoff between marketing and sales. The process follows a simple sequence: a lead enters the system, gets scored on fit and buyer intent, is routed based on the score, and the outcome (won, lost, or still nurturing) feeds back into the model to better coordinate marketing efforts.
What Lead Scoring Should Help a Team Decide
Before building any model, define what decisions it must support. Lead scoring helps sales teams focus on high-value leads, but only if the team agrees on what those decisions look like.
Core decisions a lead scoring model should answer:
- Who gets outreach first? Which leads receive a same-day phone call versus a three-day email sequence?
- What counts as a Marketing Qualified Lead (MQL)? At what score does marketing hand a lead to sales?
- Which leads stay in nurture? Low scores should not be deleted; they should enter an automated email track until behavior changes.
- Which leads get disqualified? Competitors, student emails, and companies outside the serviceable market should lose points, not gain them.
Lead scoring helps categorize leads as hot, warm, or cold. A concrete SDR workflow might look like this: leads scoring above 70 become same-day call priorities; leads between 40 and 69 enter an email cadence; leads under 40 stay in nurture until new activity pushes them up.
Consider a U.S. B2B SaaS company generating 2,000+ new leads per month from SEO campaigns, paid search, and webinars. Without scoring, reps treat every inbound form fill the same. With scoring, the team can segment by sales priority and focus on the leads most likely to convert.
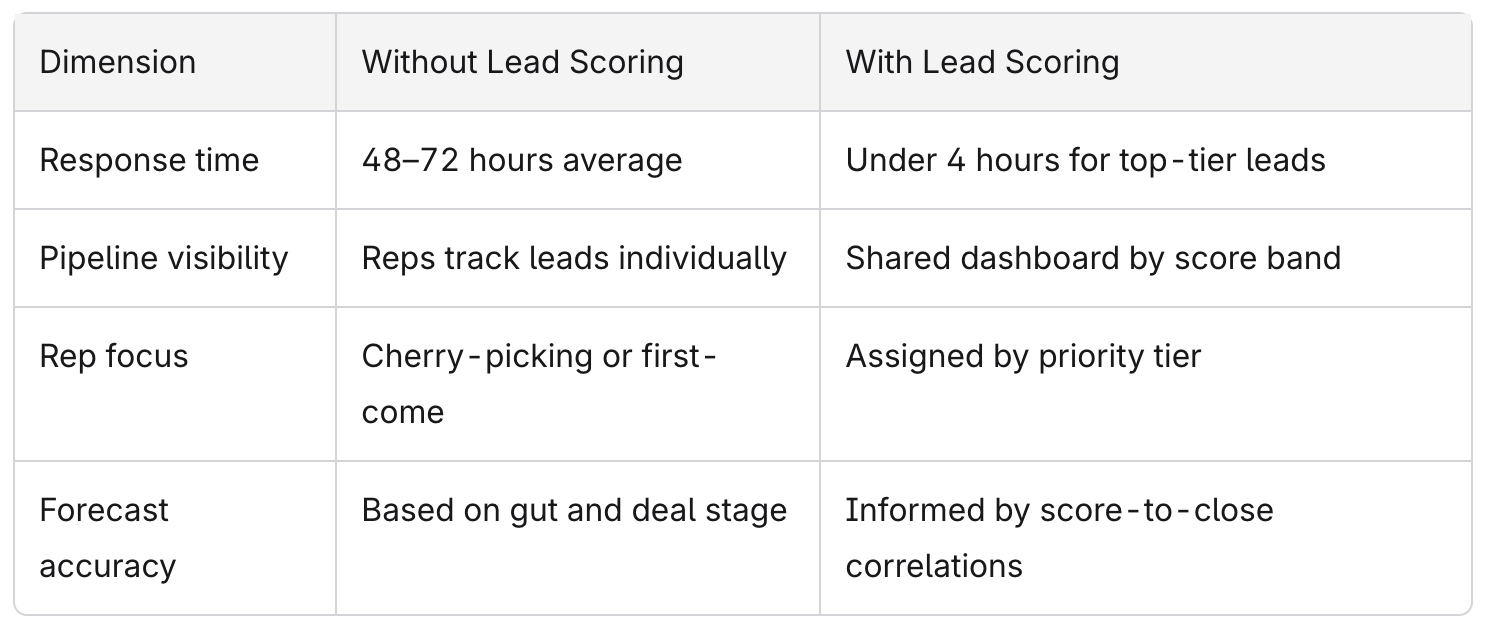
The goal is not a "perfect" score. It is a reliable ranking that aligns with revenue outcomes so sales efforts land where they count.
What Is Lead Scoring? (Plain-English Definition + Use Cases)
Lead scoring ranks potential customers based on behavior and demographics. Each lead receives a numeric value reflecting how closely they match the ideal customer profile and how actively they are engaging with the business. A higher total score indicates a prospect is more ready to buy.
Lead scoring improves sales efficiency by identifying high quality leads before reps pick up the phone. In the broader lead generation process, scoring sits between lead capture and opportunity creation: awareness brings visitors, content captures their information, scoring ranks them, nurture warms the lower tiers, and sales converts the top ones into qualified leads.
A few examples across different industries:
- U.S. B2B agency: Scores leads based on company size, marketing budget, and whether the prospect visited the services page or downloaded a case study. Leads from referrals start with a higher baseline than leads from a generic blog post.
- Regional healthcare provider: Scores on geography (must be within a 50-mile radius), insurance type, and appointment-request behavior. Fewer leads overall, so thresholds are lower.
- Mid-market software vendor: Scores on feature-page visits, free-trial signups, and the prospect's role. A VP of Marketing requesting a demo scores higher than a student downloading a whitepaper.
Lead scoring is independent of any specific software. It is a logic layer and scoring model that can be implemented in Salesforce CRM, HubSpot, or even a spreadsheet. The tool matters less than the thinking behind the rules.
Score Fit and Intent Separately
The most common mistake in early lead scoring models is mashing every signal into one undifferentiated number. A better approach: separate fit (who the lead is) from intent (what the lead is doing).
Why this matters: a perfect-fit account with zero recent activity is not the same as a small buyer submitting a demo request at 11 PM. Both may deserve attention, but in different ways and on different timelines.
A simple 2x2 mental model clarifies the four buckets:
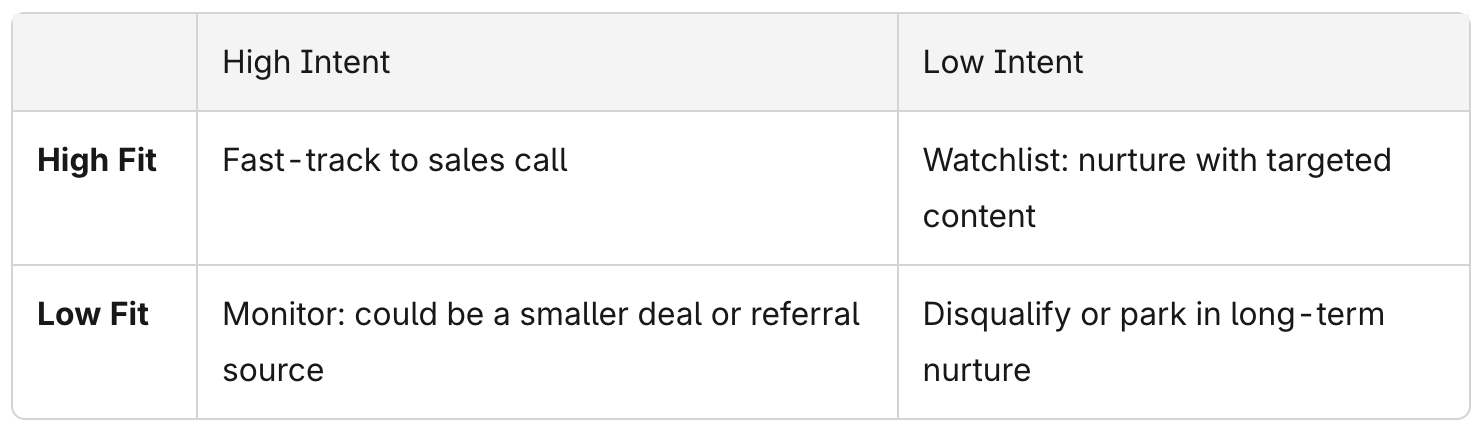
Fit signals include industry vertical, company size, geographic location, job title, and tech stack. Intent signals include demo requests, pricing page visits, webinar attendance, and email engagement.
Example: A director of marketing at a 200-person SaaS company (high fit) who has not visited the site in 90 days (low intent) belongs on the watchlist. A freelancer (low fit) who just submitted a "book a call" form (high intent) might convert quickly but at a lower contract value. Scoring fit and intent separately lets sales and marketing teams make that distinction instead of burying it in a blended number.

Behavior, timing, source, and lifecycle stage
Behavior, timing, acquisition source, and lifecycle stage are all components of intent. They should not carry equal weight.
Behavior: Visiting the pricing page twice in 48 hours signals purchase consideration. Reading a top-of-funnel blog post signals curiosity. Implicit data includes behaviors like website visits and email interactions, but a single "book a demo" submission is often worth more than a dozen low-intent content views.
Timing: A lead who signed up yesterday and visited three product pages is more urgent than a lead who downloaded a guide six months ago and has not returned. Recent activity should multiply an otherwise average score rather than just add a flat number.
Source: Leads from a direct demo request or referral tend to convert at higher rates than leads from a newsletter signup or a third-party list. A prospect arriving through paid ads with commercial intent keywords (terms like "best" or "review") is closer to making a purchase than someone browsing informational content. Users searching commercial keywords are evaluating options, and content targeting commercial keywords can improve conversion rates because the user intent is already aligned with buying.
Lifecycle stage: A new lead, an MQL, an SQL, an open opportunity, an existing customer, and an expansion target all carry different weights. Scoring should reflect where a lead sits in the sales funnel, not treat every lifecycle stage identically.
These dimensions work best as multipliers or modifiers. For example, a lead with moderate fit who visited the pricing page three times in the last 24 hours should jump ahead of a high-fit lead who has been dormant for four months.
Choosing the Right Fit Criteria for Your Business
Fit criteria come from your CRM fields. The most useful ones for scoring:
- Industry: Does this company operate in a vertical you serve well?
- Company size: Employee count or revenue band. A firm targeting mid-market (50–500 employees) should not give equal weight to a 10-person startup.
- Geography: U.S.-based? North America? Global? Explicit data includes job title, company size, industry, and location, and all four should appear in your fit rubric.
- Role and seniority: A VP of Sales filling out a form is a different signal than an intern doing research.
- Tech stack: If your product integrates with specific platforms, knowing a lead already uses those tools raises the fit score.
Pull your last 12 months of closed-won deals from your CRM. Look for patterns: which industries showed up most often? What was the median company size? Which job titles signed the contract? Then compare those attributes against churned or low-margin accounts. The gap between your best and worst customers defines your fit profile.
Firmographic thresholds shift based on your go-to-market motion. An SMB-focused company might score any business under 50 employees as high fit. An enterprise team might set the floor at 1,000 employees. A B2B service firm targeting 50–500 employee companies in North America would weight that band highest and penalize leads from outside it, while a smaller site or newer brand should usually prioritize more attainable opportunities first.
One adjustment example: a SaaS company initially scored all "marketing" titles equally. After reviewing closed-won data, they found that directors and VPs closed at 3x the rate of coordinators. Raising the score for senior titles and lowering it for junior ones improved their MQL-to-SQL conversion rate within a single quarter.
Translating Behaviors into an Intent Score
Converting digital actions into an intent score starts with ranking behaviors by proximity to a purchase decision.
A directional hierarchy, from highest to lowest intent:
- Requested a proposal or demo
- Visited the pricing page more than once
- Attended a live webinar or product walkthrough
- Downloaded a bottom-of-funnel asset (case study, ROI calculator)
- Opened and clicked a sales email
- Downloaded a top-of-funnel guide
- Visited a single blog post once
Early-stage content consumption (reading a blog post, following on social media) is low-intent behavioral data. Bottom-of-funnel engagement (pricing, case studies, comparison pages) directly correlates with higher conversion rates.
Traffic source adjusts expected intent. A lead from organic traffic who read three product pages in one session behaves differently from a lead who clicked a broad-match Google Ads campaign and bounced after 10 seconds. Partner referrals often arrive with context already established, raising their baseline intent.
24-hour high-intent pattern example: A lead visits the homepage on Monday morning. By Monday afternoon, they have viewed two case studies and the pricing page. Tuesday morning, they open a nurture email and click through to a comparison page. Each action adds points. By Tuesday afternoon, their intent score has crossed the MQL threshold, and the SDR gets an alert. This pattern, compressed into 36 hours, is more valuable than the same actions spread over three months.
Building a Simple, Predictive Lead Scoring Model
A practical combined model splits the total score into two halves:
- Fit Score: 0–50 points based on firmographics and role data
- Intent Score: 0–50 points based on behavior, timing, source, and lifecycle stage
- Total: 0–100
Set cutoffs using historical conversion data, not guesswork:
- 0–29: Disqualified or long-term nurture
- 30–49: Active nurture track
- 50–69: MQL; enters email cadence with marketing teams monitoring for further engagement
- 70–100: Sales-ready; SDR calls within 4 hours
Fit accounts for stability and long-term value. Intent governs urgency. A lead can have high fit (45/50) but low intent (10/50), landing at 55. That lead is an MQL on the watchlist, not a same-day call. Conversely, a moderate-fit lead (30/50) with high intent (40/50) scores 70 and gets immediate outreach.
Worked example: A director of operations at a 300-person logistics company (industry match: +15; company size match: +10; seniority: +10; U.S. geography: +5 = Fit 40/50) visits the pricing page twice, downloads a case study, and opens three emails in the past week (pricing page: +12; case study: +8; email engagement: +6; recency multiplier: +4 = Intent 30/50). Total: 70. Label: Sales-ready. The SDR calls within 4 hours.

Test the Model Before Automating It
Do not hard-code scoring rules into your CRM on day one. Run a manual pilot first.
Pilot process:
- Select 50–100 new leads each week.
- Apply the scoring model in a spreadsheet.
- Route leads to sales based on the scores.
- Collect sales feedback: did the score match the conversation quality?
- Compare predicted quality against actual opportunities created.
Lead scoring models can be continuously refined based on conversion analysis. A lead-to-customer conversion rate is calculated as (converted leads / total leads) x 100. Track this metric by score band to see where your model is accurate and where it over- or under-predicts.
Metrics to watch during the test:
- MQL-to-SQL conversion rate by score band
- Average time-to-first-touch by score band
- Opportunity creation rate for leads scoring above 70 vs. below 50
Example adjustment: One company found that pricing page views were overweighted. Students and freelancers visited pricing out of curiosity, inflating MQL volume with leads that had poor fit on company size. The fix: pricing page visits only contributed full points when the lead's fit score was already above 25. That single rule change cut false MQLs by roughly a third.
Run the pilot for at least one full sales cycle (typically 30–90 days for B2B) before committing rules to automation.
Common Lead Scoring Mistakes (and How to Avoid Them)
- Treating every data point as equal. A demo request is not the same as opening an email. Weight actions by proximity to a purchase decision. A dozen low-intent content views should not outscore a single proposal request.
- Overcomplicating the model with dozens of minor signals. One company built a model with 40+ scoring rules. SDRs could not explain why a lead scored 63 vs. 58. They stopped trusting the scores entirely. The fix: collapse the model into 10–12 core rules covering the top fit and intent signals. Improving accuracy matters more than adding more fields.
- Setting MQL thresholds based on guesswork. If "70" is the MQL cutoff because it "felt right," revisit it with data. Pull the last quarter's MQLs, check how many became opportunities, and adjust.
- Ignoring negative signals. Negative scoring penalizes actions like unsubscribing or inactivity. Student email domains (.edu), competitor company names, and extended periods of no engagement should subtract points. Without negative scoring, dead leads clog the pipeline.
- Failing to revisit scores when the ICP changes. A company that moves upmarket from SMB to mid-market needs different fit criteria. Static models built on old data decay fast with new data and new market conditions.
- Over-relying on a tool's default scoring model. Most CRMs and marketing platforms ship with generic scoring templates. Those defaults do not know your industry, your buyer, or your sales cycle. Customize before trusting.
- Not involving sales in the design. If reps were not consulted when the model was built, they will not trust the output. Include at least one senior rep in the initial design session.
Aligning Sales and Marketing Teams Around Scoring Thresholds
Lead scoring aligns marketing and sales by defining qualified leads in terms both teams agree on. Without that agreement, marketing celebrates MQL volume while sales complains about lead quality, while scoring thresholds align both teams’ marketing efforts around the same definition of a qualified lead.
Calibration cadence: Meet monthly (or quarterly, for smaller teams) with a specific agenda:
- Review score-band performance from the prior period
- Pull 5–10 scored leads and compare scores to actual outcomes
- Discuss any "surprises" where a high-scored lead went nowhere or a low-scored lead closed fast
- Adjust thresholds or weights based on findings
Example threshold change: After launching a broad paid campaign, a company saw MQL volume jump 40% in one month. The sales team was overwhelmed with leads scoring 60–65 that rarely converted. Raising the MQL cutoff from 60 to 70 reduced MQL handoffs by 25% but increased MQL-to-SQL conversion rates because reps focused on better-qualified leads.
Clear definitions reduce friction, delivering just what each team needs from the handoff process. Fewer "these leads are bad" complaints. Better feedback loops when marketing strategies change or new channels come online.
When (and When Not) to Automate Lead Scoring
Automation makes sense once three conditions are met:
- Lead volume exceeds manual capacity. If your team handles 200–300+ new leads per month across multiple sources, manual triage will slow response times.
- The scoring model is tested. At least one full quarter of data using a draft model, with documented adjustments.
- Sales and marketing agree on thresholds. Automating disputed rules just automates the argument.
Two types of automation exist:
- Rule-based automation: If/then logic in a CRM. "If lead visits pricing page AND company size > 50 employees, add 15 points." This is where most teams should start.
- Predictive lead scoring: AI lead scoring uses machine learning algorithms for predictions, analyzing historical conversions to assign scores between 0 and 100 to leads. AI lead scoring continuously learns from new lead data and can surface patterns that rule-based models miss. Teams still need ai insights they can understand and explain before they trust automated prioritization. AI lead scoring uses machine learning to predict lead conversion likelihood, but data cleaning is essential for effective AI lead scoring. Without clean CRM records, the model learns from noise. AI lead scoring improves sales efficiency by prioritizing high quality leads, but it requires enough historical conversion data to train on.
When not to automate: A startup generating 30 leads per month does not need automation. A spreadsheet and a 15-minute weekly review will do. Automating too early risks hard-coding bad rules that bury good leads or flood reps with unqualified MQLs. Lead scores can trigger automated nurturing campaigns for low-scoring leads, but only after the nurture sequences themselves are tested and producing results.
A scale-up at 1,500 leads per month across three regions, on the other hand, cannot function without automation. The volume demands it, and the tested model justifies it.
What Information Should a Lead-Scoring Model Use?
Core information categories:
- Fit: Industry, annual revenue, company size, role and seniority, geography. These fields come from CRM records, enrichment tools, or form submissions.
- Intent and behavior: Web visits (especially product pages and the pricing page), content downloads, email engagement, webinar attendance, social media engagement, and demo requests.
- Source and campaign: UTM parameters, acquisition channel (paid ads, organic traffic, partner referral). Traffic generated from content planned with keyword research tools feeds into scoring when you know which keywords means commercial versus informational intent. For example, leads arriving through content built using the Keyword Magic Tool or Google Keyword Planner tend to have identifiable search intent tied to their entry path, and teams often compare average monthly searches to gauge demand during research. These keyword tools also help verify search intent and prioritize terms.
- Lifecycle and history: Days since first touch, number of past opportunities, existing customer flag, expansion target status.
Data quality matters more than the volume of fields. A CRM with 50 fields where 30 are empty is less useful than 12 well-maintained data points that reps actually update. Focus on the fields that correlate with closed-won deals and score leads based on those.
Commercial intent keywords indicate users are evaluating options. Examples of commercial intent keywords include "best" and "review." Commercial keywords often have lower competition than transactional keywords, making them worth targeting in SEO campaigns and content planning. But a high-volume term can still be a poor target if it comes with high competition. In many cases, low difficulty terms are a smarter place to start when the goal is to rank faster. A smaller site usually gains more from attainable opportunities than from broad, crowded queries. Knowing which search terms drove a lead to your specific site helps calibrate the intent score, especially if you review the search results and the results page to see how Google is interpreting the query.
Practical Examples of Lead Scoring in Action
Scenario 1: U.S. B2B SaaS company using webinars and SEO
This company generates 1,800 leads per month. Fit criteria: 100–1,000 employees, North American headquarters, VP or director title in marketing or sales. Top intent signals: webinar attendance, pricing page visit, case study download, demo request. Threshold: leads scoring 70+ get a same-day call; 50–69 enter a 5-email nurture sequence. After implementing scoring, the team stopped chasing low-fit leads from high volume keyword campaigns and shifted toward terms more likely to bring more traffic while still matching buyer intent, redirecting sales efforts toward prospects matching their ICP. The result was more revenue from the same headcount, with reps handling fewer but higher-converting conversations.
A case study from Uncommon Logic documented a B2B SaaS company that nearly doubled lead quality and cut cost per MQL by 53% over 15 months by aligning scoring with paid media optimization.
Scenario 2: Services firm relying on referrals and paid search
A mid-size consulting firm receives 300 leads per month. Fit: companies in financial services or healthcare, 200+ employees. Intent: referral source (highest weight), Google Ads click on a service-specific landing page, follow-up email opened within 24 hours. Threshold: referral leads with fit match skip directly to a senior consultant call. If the firm were targeting specific service areas, local SEO would matter more here as well. Paid search leads enter a two-touch email sequence before phone outreach. This approach helped the firm close more deals from referrals while giving paid leads time to warm up.
Scenario 3: Mid-market eCommerce platform focusing on free trials
A platform offering a 14-day free trial scores on user behavior inside the product: number of features activated, items listed, and whether the user invited a teammate. Fit criteria are lighter here; company size matters less than product engagement. A trial user who activates three core features in the first 48 hours scores as sales-ready. A user who signs up and never logs in again stays in automated nurture. This model helped the team reach more customers who were already experiencing value, rather than cold-calling trial signups who never explored the product. It also made it easier for reps to focus on trial users already seeing value.
In a separate case documented by Disruptive Advertising, a B2B SaaS client increased new customer acquisition by 34% and lowered cost per acquired customer from $546 to $451 by scoring and segmenting leads based on intent and fit.

Frequently Asked Questions About Lead Scoring
These questions come up regularly from sales leaders, marketing teams, and founders evaluating whether scoring fits their business.
What is lead scoring?
Lead scoring is a method of assigning numeric values to potential customers based on their fit (demographics, firmographics) and their behavior (website visits, email clicks, content downloads). The purpose is to rank leads so the sales team pursues the most promising prospects first, rather than treating every inquiry equally. It is one of the most direct ways to turn a growing pipeline into actionable insights.
What information should a lead-scoring model use?
A lead scoring model should use fit data (industry, company size, job title, geography), intent and behavioral data (page visits, content engagement, demo requests), source data (how the lead arrived), and lifecycle stage (new lead vs. returning prospect vs. existing customer). The model works best when built on well-maintained CRM fields rather than dozens of half-populated data points from multiple sources.
When should lead scoring be automated?
Automate after the business consistently generates enough leads that manual triage slows response time (typically 200+ leads per month), has at least one quarter of tested scoring rules, and has agreement between sales and marketing on MQL definitions. Without those conditions, automation risks encoding flawed assumptions.
How often should we update our lead-scoring rules?
Review scoring rules quarterly at minimum. Revisit sooner if you launch a new product, enter a new market, change your ICP, or see a gap between MQL volume and SQL conversion. Lead scoring models that sit untouched for a year will drift from reality as the market, your product, and buyer behavior change.
Do we need AI to start with lead scoring?
No. Most businesses should start with a manual, rule-based model in a spreadsheet or basic CRM automation. An AI platform or predictive scoring tool adds value once you have enough historical data (typically 1,000+ closed-won and closed-lost records) for machine learning to find patterns that human error or manual rules might miss. Free tools and built-in CRM features can handle the basics. AI tools become worth pursuing when volume and data maturity justify the investment.
Next Steps: Request a CRM and Lead-Management Review
If your team is generating leads from organic results, paid search, referrals, or social media but lacks a consistent way to score leads before routing them, the next step is an audit of your current setup.
A CRM and lead-management review typically includes: auditing existing fields and buyer intent signals, mapping lifecycle stages from first touch to closed-won, and identifying gaps where simple rule changes could improve prioritization. The goal is to avoid overcomplicating the CRM and ensure lead scoring supports rather than confuses the sales team.
Come prepared with data from your last 3–6 months of leads, including conversion rates by channel, average deal size by lead source, and any search volume or keyword difficulty benchmarks from keyword research that shaped your content planning, along with the latest trends. Teams should compare demand with competitiveness so they do not chase terms with high competition too early, and smaller sites should also include attainable terms in research. That data turns the review from abstract to concrete, and gives your team a foundation to build a scoring model that reflects how your best customers actually buy.