Marketing Dashboard: What Leadership Actually Needs to See Before Making Budget Decisions
A company can have more marketing data than ever and still struggle to make a confident budget decision.
Advertising platforms report clicks and impressions. Email tools report opens. Website analytics show visits. The CRM tracks leads and opportunities. Sales reports revenue. Each system provides part of the story, but leadership may not have one reliable view of what marketing is producing.
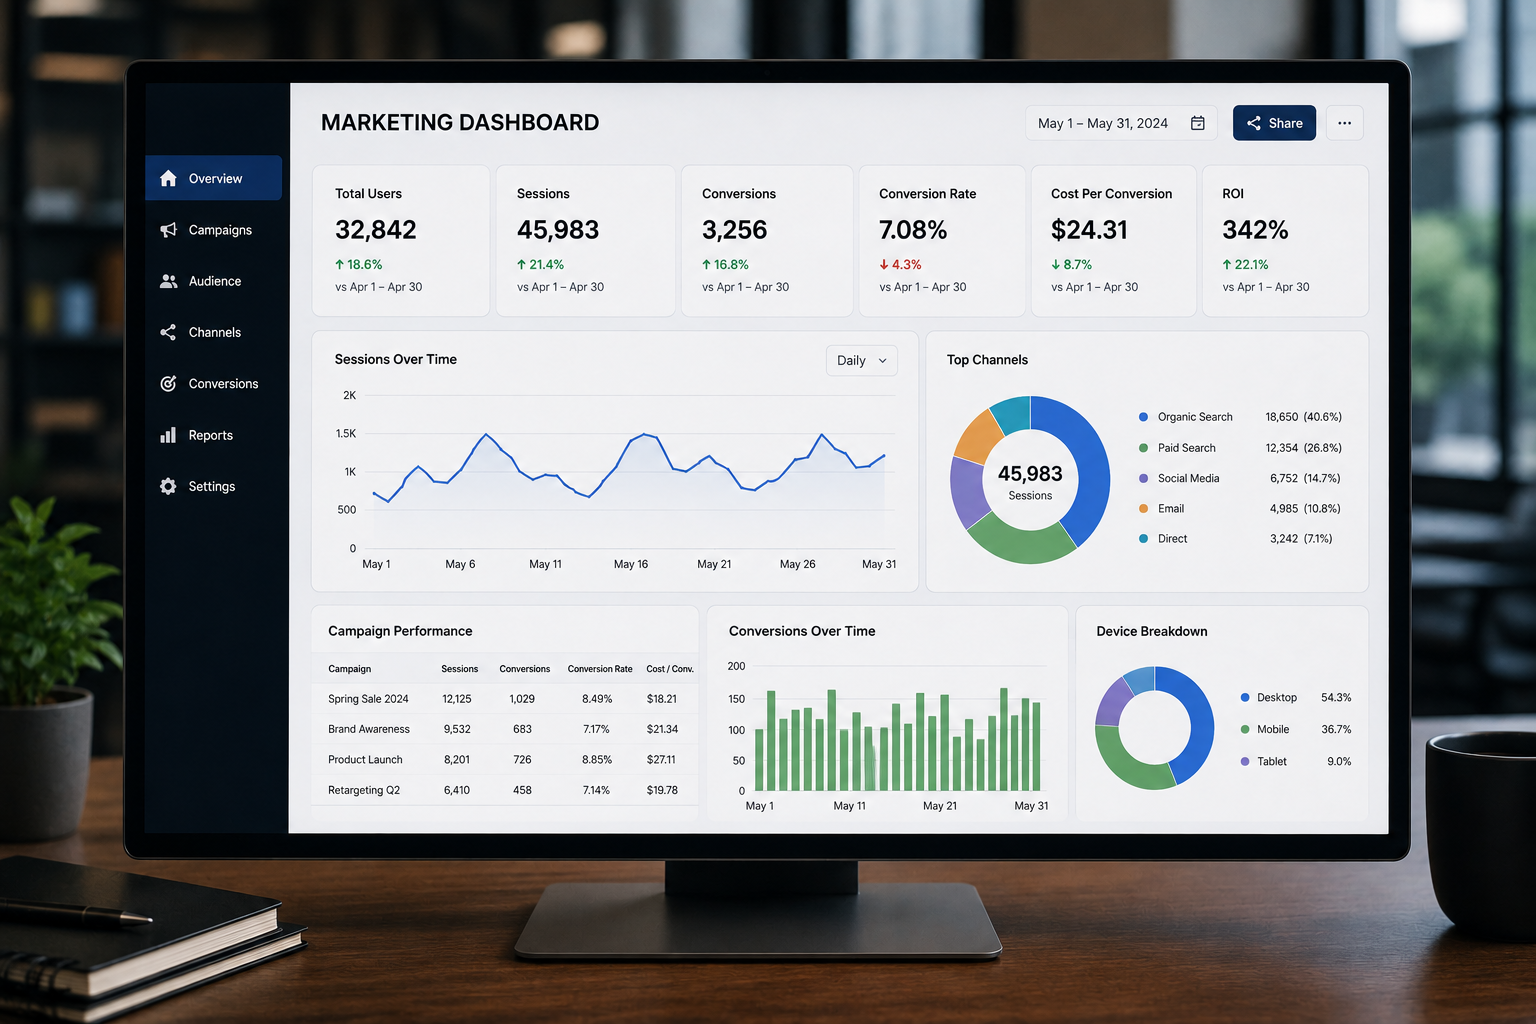
A professional marketing dashboard brings the right information together so founders, CEOs, marketing leaders, and operations leaders can make informed decisions. It connects marketing activity with business outcomes instead of presenting disconnected platform totals.
The goal is not to display every available number. Leadership needs a focused view of marketing KPIs, campaign reporting, lead metrics, conversion data, and pipeline reporting. The dashboard should make it easier to understand what is working, what needs attention, and where the company should invest next.
Masterly Tech helps businesses design and build decision-ready dashboards around their actual systems, goals, and reporting needs.
When More Marketing Data Analytics Creates Less Clarity
Many leadership teams receive reports from several platforms. These reports may be accurate within each system, but they often use different definitions, time periods, and attribution rules.
A paid advertising platform may report a conversion whenever someone completes a form. The CRM may count only qualified leads. Sales may focus on opportunities or closed revenue. Marketing may report every response as a lead, while leadership expects a lead to represent a serious prospective buyer.
Everyone may be using valid numbers, yet the company still cannot agree on performance.
This creates several problems. Leaders may delay budget decisions because they do not trust the reports. Marketing teams may spend hours combining spreadsheets before each meeting. Agencies may present strong platform results that cannot be connected to pipeline activity. Sales and marketing may disagree about lead quality because their systems measure different stages.
A dashboard should resolve these conflicts by creating a shared reporting structure. If it simply places inconsistent numbers on one screen, it does not solve the real problem.
A Marketing Dashboard Must Support Leadership Decisions
An effective marketing dashboard begins with the decisions leadership needs to make.
Executives may need to decide whether to increase a campaign budget, reduce spending on an underperforming channel, adjust a service offer, or improve the way leads move from marketing to sales. Marketing leaders may need to compare campaigns, identify conversion problems, or evaluate agency performance. Operations leaders may need to understand whether the company has enough capacity to support expected demand.
The right dashboard gives each decision-maker enough context to evaluate those questions.
This does not mean every person needs a completely separate reporting system. It means the dashboard should organize information according to business priorities. High-level results should be easy to find, while supporting details should remain available when a deeper review is needed.
Masterly Tech works with leadership and operating teams to identify those priorities before dashboard development begins. This helps prevent the final report from becoming a crowded collection of charts with no clear purpose.
Marketing KPIs Should Connect Digital Marketing Strategies, Activity With Outcomes
Marketing KPIs are useful when they reflect meaningful progress toward a business objective. The most visible number is not always the most valuable one.
Impressions, clicks, views, and engagement can provide helpful context, and impressions measure how often content is displayed to users, but they do not automatically show business impact. Leadership also needs to understand what happened after a person interacted with the campaign.
Did the visitor reach the right page? Did the person complete a meaningful action? Did the lead meet the company’s qualification requirements? Did sales accept the lead? Did the activity contribute to an opportunity or customer relationship?
A decision-ready dashboard connects activity metrics with outcome metrics. Only 23% of marketers track the right KPIs, which is why selection should focus on what will matter most. This allows leadership to see whether strong engagement is producing useful business results.
The correct KPIs depend on the organization. A professional services company may focus on qualified inquiries and consultation requests. A company with a longer sales process may need to monitor opportunity creation, sales acceptance, and pipeline value. A business with several services may need to compare conversion performance by service line.
Masterly Tech helps define KPIs that match the company’s operating model rather than relying on a general dashboard template, connecting teams to the right data needed to evaluate marketing success. For example, conversion rate is calculated by dividing conversions by total visitors, customer acquisition cost is calculated by dividing total marketing expenses by new customers, and ROI is calculated by subtracting marketing costs from generated revenue.
Campaign Reporting Needs a Shared Measurement Standard
Strong campaign reporting makes it possible to compare results across channels, time periods, audiences, and offers. Those comparisons support data driven decisions. That comparison becomes unreliable when campaigns use different tracking rules.
One team may identify a campaign by platform. Another may identify it by service. An agency may use its own naming structure. CRM campaign records may not match the names used in website analytics.
These differences can divide related data or combine unrelated activity. Leadership may see several versions of the same campaign without realizing they belong together.
A useful marketing dashboard depends on clean campaign definitions, consistent tracking values, and agreed reporting periods. It should also make clear which system serves as the source for each metric. These standards are essential for campaign management and reliable marketing success.
For example, the advertising platform may be the source for media spend. Website analytics may provide session and engagement data. The CRM may be the source for qualified leads, opportunities, and revenue. Those sources must be connected carefully so the dashboard does not compare unrelated numbers.
Masterly Tech reviews the reporting structure behind the dashboard, including campaign naming, tracking parameters, data sources, and system connections, to connect the right data for reporting that reflects what matter.
Lead Metrics Must Reflect Qualified Leads and Real Business Qualification
Lead metrics can create confusion when teams do not share one definition of a lead.
A website form submission may be counted as a conversion in an advertising platform. Marketing may call it a lead. Sales may not consider it qualified until someone reviews the inquiry. Leadership may only want to see prospects who meet specific service, budget, location, or timing requirements.
If a dashboard reports all form submissions as equal, it may overstate performance, so leadership should separate raw inquiries from quality leads. A campaign that generates many low-quality inquiries may appear stronger than one that produces fewer but more valuable prospects.
Leadership should be able to distinguish between important stages, such as:
- Initial inquiries
- Marketing-qualified leads
- Sales-accepted leads
- Sales-qualified opportunities
- Closed customers
The exact stages will vary, but the definitions must remain consistent. Each stage should represent a real change in the prospect’s relationship with the company.
Masterly Tech helps businesses align lead metrics with CRM stages, qualification rules, and reporting requirements. This gives leadership a more accurate view of marketing quality, not only marketing volume, so reporting reflects measurable results for the business and for clients when service delivery is involved.
Conversion Data Shows Where Marketing Performance Breaks Down
Conversion data helps leaders understand how prospects move from initial interest to a meaningful business result as part of broader marketing performance analysis.
A dashboard should do more than show one total conversion rate. It should reveal where prospects are progressing and where they are leaving the process.
A campaign may attract the right audience but send visitors to a weak landing page. A page may generate inquiries, but the forms may not collect enough information for proper qualification. Marketing may deliver qualified leads, but sales follow-up may be delayed. A strong pipeline may exist, but opportunities may remain open without a clear next step.
These are different problems, and each requires a different decision. Better data analytics helps teams identify where visitors fail to convert and what necessary adjustments to make.
When conversion stages are visible, leadership can direct resources toward the part of the system that needs attention. Without that view, the company may spend more on traffic when the real issue is lead handling or follow-up.
Masterly Tech can bring conversion data from relevant systems into a reporting structure that supports a data-driven review of conversion performance.
Pipeline Reporting Connects Marketing With Revenue
Pipeline reporting helps leadership see whether marketing activity is contributing to potential revenue.
This connection is especially important for businesses with longer sales cycles. A campaign may not produce immediate revenue, but it may create qualified opportunities that progress over several weeks or months.
A dashboard can help leadership examine:
- Opportunities connected with marketing sources
- Pipeline value by campaign or channel
- Progress through sales stages
- Average time between lead creation and opportunity creation
- Closed business connected with marketing activity
- Campaigns that generate interest but limited pipeline
Filtering also lets a user analyze pipeline by specific campaigns, timeframes, or geographic regions without changing the underlying definitions.
Reliable pipeline reporting depends on consistent CRM use and accurate source data. If sales teams do not update opportunity stages or campaign information is lost before the lead enters the CRM, the dashboard cannot provide a complete view.
Masterly Tech reviews both the reporting layer and the systems that supply the data. This helps uncover operational gaps that may be affecting the dashboard’s accuracy.
An Executive Dashboard Should Reduce Reporting Noise
An executive dashboard should make important information easier to understand, replacing manual reporting with automated data visualization. It should not require leadership to search through dozens of charts before finding the answer to a basic question.
A focused executive view may include marketing investment, qualified lead volume, conversion performance, pipeline contribution, and major changes that require attention. Alerts and anomaly detection can flag sudden KPI changes for faster leadership review, which is another benefit for busy teams. Supporting reports can provide additional detail for marketing and operations teams.
Clear design matters because presentation affects understanding. Labels should be direct. Time periods should be obvious. Definitions should remain consistent. Charts should help explain a decision rather than decorate the screen.
The dashboard should also provide enough context to prevent misleading conclusions. A decline in lead volume may be acceptable if lead quality has improved. A higher cost per lead may be reasonable if those leads produce more pipeline. A strong traffic increase may have limited value if conversions remain flat.
Masterly Tech develops dashboards that organize this context around the questions leadership needs answered. Automated reporting can schedule updates and share insights with stakeholders.
Why Leadership Loses Trust in Marketing Reports
Trust can decline when numbers change from one meeting to the next without a clear reason. It can also decline when reports from marketing, sales, finance, and outside agencies do not agree.
This does not always mean someone made a mistake. The difference may come from attribution windows, time zones, duplicate records, delayed CRM updates, or separate definitions. However, unexplained differences can damage confidence.
Once leaders stop trusting the data, even accurate reports may be questioned. Marketing teams may then spend more time proving the numbers than using them.
A reliable marketing dashboard requires documented definitions, stable data sources, clear ownership, and a process for handling reporting changes. These standards protect both the data and the people responsible for presenting it.
Masterly Tech helps businesses address the system and governance issues behind reporting trust.
Done-for-You Marketing Dashboard Support From Masterly Tech
Masterly Tech provides done-for-you dashboard and analytics support for digital marketing reporting, helping companies get clearer performance data.
Our work may include reviewing existing reports, identifying leadership decisions, defining marketing KPIs, mapping data sources, assessing tracking quality, connecting analytics with CRM information, and building an executive dashboard.
We can also examine the systems behind the reports, including forms, campaign tracking, integrations, CRM fields, lifecycle stages, attribution data, and the software used for analysis. This broader review helps prevent inaccurate or incomplete data from being presented in a polished dashboard, and AI-assisted analysis can optimize digital marketing strategies for better ROI.
Applied to reporting and optimization workflows, AI can improve conversion rates by 65% and save up to 70% in time and costs for marketing activities.
The final approach depends on the company’s size, sales process, platforms, and leadership needs. A founder-led business may need one focused performance view. A growing organization may need separate executive, marketing, and operations views that use the same core definitions.
AI-driven strategy can support measurable growth, generate over 1,000 qualified leads, and enhance SEO by identifying ranking opportunities, but long-term success still depends on reflecting the company’s actual sales process and goals.
Masterly Tech builds around the business rather than forcing the business into a standard dashboard, with room for innovation as needs change.
Frequently Asked Questions About Marketing Dashboards
What is a marketing dashboard?
A marketing dashboard brings important campaign, lead, conversion, and pipeline data into one reporting view. It helps teams monitor performance and support business decisions.
What should leadership see on a marketing dashboard?
Leadership should see the metrics connected to budget, qualified demand, conversion performance, pipeline, and business outcomes. The exact metrics depend on the company’s goals.
What are the most important marketing KPIs?
Important marketing KPIs may include qualified leads, conversion rates, acquisition costs, pipeline contribution, and revenue influence. The right KPIs depend on the business model; one example is customer acquisition cost, tracked by comparing marketing and sales spend from CRM and accounting data against new customers won.
Can a dashboard connect marketing data with CRM reporting?
Yes. A dashboard can connect campaign activity with CRM lead, opportunity, and customer data when tracking and integrations are configured correctly.
Why do marketing and sales reports show different numbers?
The reports may use different definitions, systems, time periods, attribution rules, or lifecycle stages. A reporting review can identify the source of the differences.
Does an executive dashboard need every marketing metric?
No. An executive dashboard should focus on the information leadership needs to make decisions. Detailed platform metrics can remain in supporting reports.
How often should a marketing dashboard be reviewed?
The dashboard should be reviewed regularly and whenever business goals, campaigns, sales stages, platforms, or reporting requirements change.
Can Masterly Tech improve an existing dashboard?
Yes. Masterly Tech can review the current dashboard, data sources, definitions, integrations, reporting structure, and historical data to identify gaps, spot trends, and improve decision usefulness.
Request a Reporting and Analytics Review Focused on the Decisions Leadership Actually Needs to Make
Masterly Tech can build a marketing dashboard that connects marketing KPIs, campaign reporting, lead metrics, conversion data, and pipeline reporting in one decision-ready view.
Call (888) 209-4055 or visit Masterly Tech to request a reporting and analytics review.