
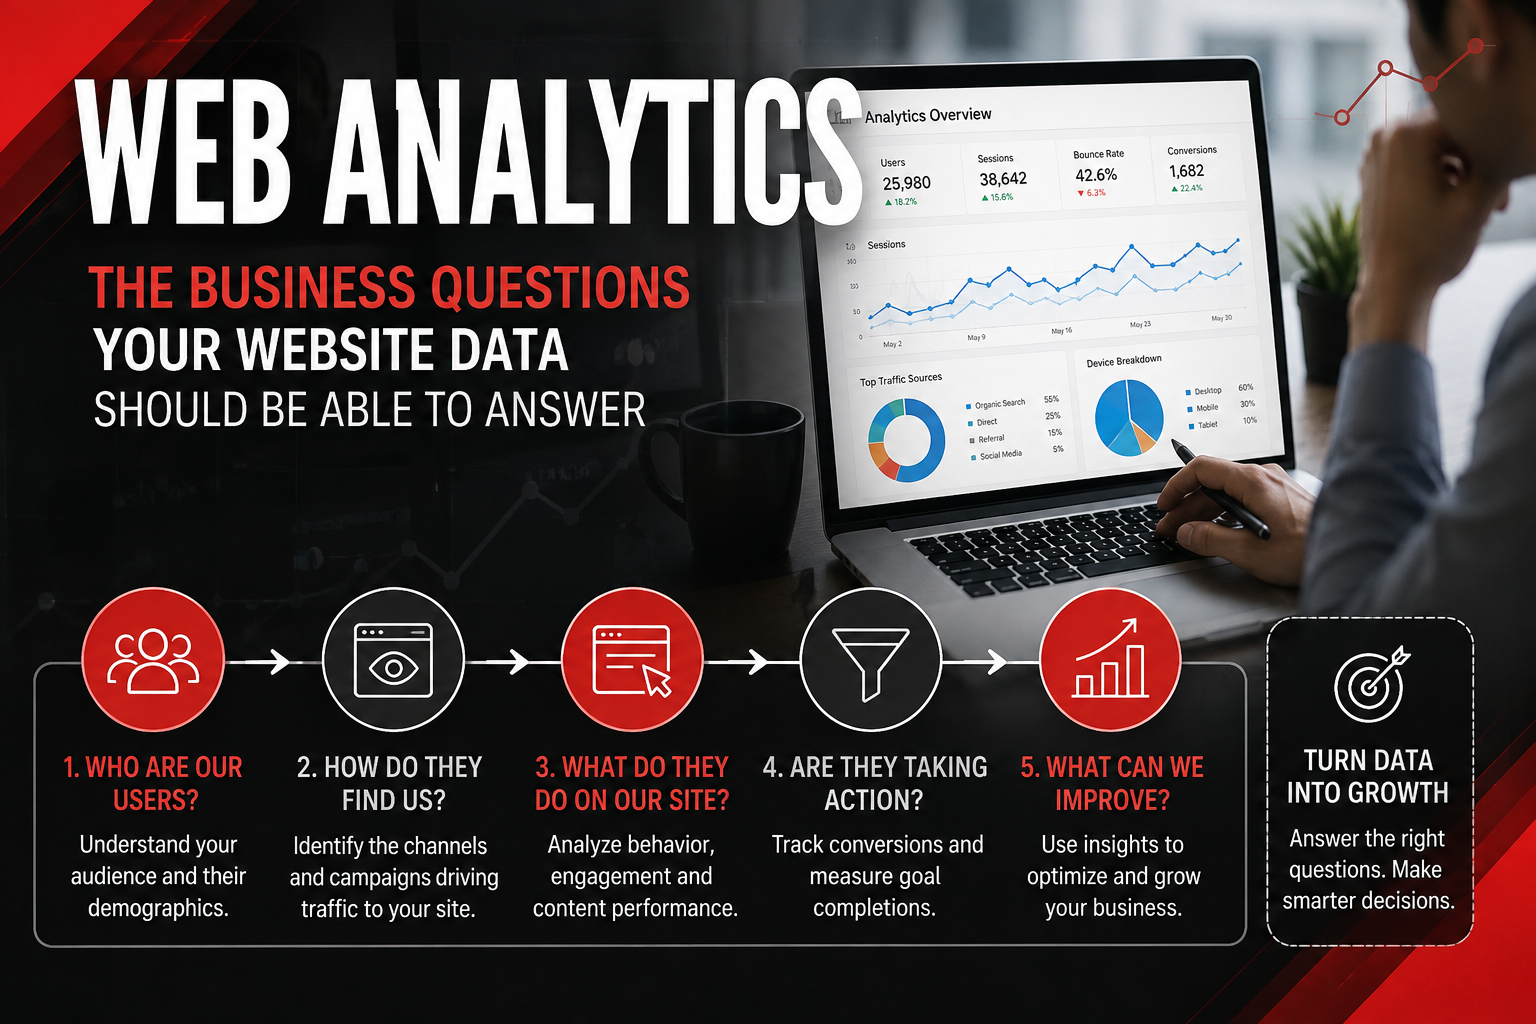
Web Analytics: The Business Questions Your Website Data Should Be Able to Answer
Why Web Analytics Is Essential for Your Online Success
Every website generates data with each visitor click, scroll, and page load. Web analytics turns website activity into evidence for decision-making. Without tracking, you cannot tell which web pages attract your target audience, where users drop off during checkout, or whether your marketing efforts produce paying customers or wasted spend.
Web analytics involves four essential stages: collection, analysis, reporting, and optimization. Raw user behavior data flows through these stages and emerges as specific recommendations: fix this landing page, shift budget to that campaign, redesign this form. The difference between a business that grows online and one that stalls often comes down to whether decisions rest on analytics data or assumptions.
If you have a website and no tracking in place, you are operating without instruments. Start by installing a free tool like Google Analytics, define your business goals, and begin collecting the data points that connect visitor activity to revenue.
Why Businesses Trust Web Analytics Data
Web analytics tools have earned widespread adoption because the data they produce is testable and repeatable.
- Industry-wide adoption: Among Fortune 1000 companies, 88% use traditional digital analytics platforms. Within the Fortune 50, that figure rises to 94%. Google Analytics and Adobe Analytics together account for roughly 99% of that adoption.
- Global scale: As of mid-August 2026, Google Analytics runs on over 19,219,111 live websites globally, covering 6.2% of all indexed sites. Among websites using any analytics tool, Google Analytics holds about 78% market share in 2026.
- Standards and compliance: Certifying bodies like the Digital Analytics Association and the IAB define terminology and auditing practices. Under GDPR, analytics platforms act as data processors while businesses remain data controllers, with features like IP anonymization and consent controls built into the platforms.
- Reproducible results: Important website metrics include traffic sources, conversion rate, bounce rate, average session duration, and page load speed. These metrics follow consistent definitions across tools, so findings can be verified independently.
Why Companies Choose Web Analytics for Growth
Guesswork costs money. A blind website redesign can take months and thousands of dollars with no guarantee of improvement. Web analytics replaces that gamble with measurable, iterative testing.
- Higher conversion rates through testing: A/B testing compares variations to improve user engagement. Rather than guessing which headline works, you run both versions and measure which one converts more visitors into paying customers. A/B testing identifies changes that maximize desired outcomes on web pages.
- Real-time response: Real-time analytics surfaces broken forms, misrouted traffic, or underperforming campaigns within minutes instead of days. Businesses running time-sensitive promotions can adjust bids or swap creative mid-campaign based on live user behavior insights.
- Competitive advantage through customer understanding: Segmentation analysis divides users into groups based on behavior, geography, device type, or traffic source. This lets you personalize experiences for different user groups and allocate budgets to the channels that produce results, not just clicks.
- Lower optimization costs: Data driven decisions eliminate the expense of fixing things that are not broken. By focusing on pages with high bounce rates or slow load times, you direct resources where they produce measurable returns.
Essential Web Analytics Services and Methods
The core analytics capabilities businesses need fall into three categories: understanding who visits, tracking what they do, and measuring whether those actions produce business results.
Traffic Analysis and User Behavior Analytics
Traffic analysis answers the first question every site owner has: who is coming, and what are they doing? User behavior includes page views, bounce rate, session duration, and user flow paths, helping you understand user behavior. Acquisition metrics include organic vs. paid traffic and the specific traffic sources that drive visitors to your site.
Traffic sources categorize visitors as organic search, paid ads, social media, direct traffic, or referral links. Understanding how users navigate your site reveals which content performs well and where navigation creates friction points. Audience demographics include geographic location, device types, browsers, and language settings; segmentation metrics analyze performance by device, geography, and user demographics to reveal patterns that aggregate numbers hide, including a specific pattern in how visitors move through the site.
Conversion Funnel Analysis
Funnel analysis visualizes user journeys through predefined steps, from initial interaction to completed purchase or signup. Conversion metrics include conversion rate, number of key events, and lead form submissions. Conversions indicate the percentage of visitors completing desired actions like purchases or sign-ups.
Funnel analysis identifies drop-off points in user journeys, with analysts analyzing data at each step to find where users abandon the journey. If 1,000 visitors add items to a cart but only 200 reach the payment page, the checkout step between them needs investigation. This data conversion from raw clicks into a visual funnel lets product teams and marketers pinpoint the exact page where the conversion process breaks down.
Real-Time Analytics and Reporting
Live dashboards show active users on your site, which pages they are viewing, and how current campaigns are performing. For businesses running flash sales, product launches, or breaking content, real-time data enables corrections in minutes rather than after a post-mortem report.
Enhancing marketing ROI requires tracking effective campaign channels or keywords as they perform, not after they have spent the budget. Real-time analytics closes the feedback loops between action and measurement.
How Web Analytics Works
The path from raw visitor activity to actionable recommendations follows three steps.
Step 1: Data Collection and Tracking Setup
Web analytics data primarily comes from two sources: web server log files and page tagging. Page tagging uses JavaScript code to collect data when a webpage is rendered in a visitor's browser. Tag managers like Google Tag Manager simplify the process of deploying and maintaining tracking scripts across multiple web pages. The extensive use of caching can reduce the completeness of log-based tracking data.
During setup, you define what to measure: goals (like form submissions or purchases), custom events (button clicks, video plays, scroll depth), and segments (new vs. returning visitors, mobile vs. desktop). Data collection methods range from client-side JavaScript to server-side logging; each has trade-offs. Imported tracking data may also need file format normalization before ingestion into analytics systems. Client-side tracking captures richer user interactions but is vulnerable to ad blockers. Server-side tracking avoids blockers but requires more infrastructure and careful handling of ip addresses and personally identifiable information.
Step 2: Data Processing and Analysis
Raw event streams need processing before they become useful. Analytics platforms group individual events into sessions (typically expiring after 30 minutes of inactivity), filter out bot traffic, and apply attribution models to assign credit across marketing channels.
Data analysis transforms existing data into segments and cohorts. Principles from computer science also inform how analytics platforms structure sessions, attribution, and large-scale processing. You can analyze user behavior by traffic source, device type, geography, or any custom dimension relevant to your business objectives. Segmentation analysis personalizes experiences for different user groups; for example, mobile visitors from paid search may behave differently from desktop visitors arriving via organic search results. Data scientists and analysts use these segments to identify areas where specific user behaviors diverge from expectations. External context in online settings can also impact user behavior, so it should be considered during analysis.
Step 3: Reporting and Actionable Insights
Reporting translates processed data into dashboards, charts, and tables organized around key performance indicators. Revenue metrics connect web behavior to financial performance, including total revenue and revenue per user. Retention metrics assess returning user rates and customer lifetime value to measure repeat business.
Reporting provides valuable information: a high bounce rate on a landing page signals poor relevance or slow load speed. Low engagement time on a product page suggests the content does not match user needs. From these observations come specific actions: rewrite copy, compress images, restructure navigation so users find relevant information faster. Teams can leverage insights from these reports to prioritize the next tests or page updates. Optimizing user experience involves analyzing navigation paths for easier visitor access.
Proven Results from Web Analytics Implementation
Businesses that act on analytics data see measurable changes. Adopting funnel analysis and redesigning workflows based on drop-off data routinely reduces abandonment rates by 10% to 40%. Websites that fix key bottlenecks identified through user behavior analysis often see conversion rate increases between 20% and 100%.
Engagement metrics measure active visitor interaction on a site, including bounce rate and average engagement time. Teams should review other metrics alongside engagement numbers before deciding what to fix. Identifying performance bottlenecks involves finding pages with high bounce rates or slow load times. When those pages get fixed, the numbers move.
The shift from Universal Analytics to GA4 forced companies to rebuild tracking setups. That process revealed gaps in previous data but resulted in cleaner, event-based tracking and more accurate multi-touch attribution. 46% of marketers now use a combination of marketing mix modeling, incrementality testing, and multi-touch attribution to understand their marketing metrics.
User behavior analysis improves customer experience and satisfaction. A/B testing enhances user engagement through data-driven decisions. Retention analysis measures user loyalty and satisfaction over time.
Success Stories: Web Analytics in Action
Ecommerce platform adoption patterns: GA4 usage among US ecommerce stores breaks down by platform: WooCommerce accounts for 31.2% of GA4-using stores, GoDaddy Online Store 17.1%, and Shopify 11.2%. These figures help platform providers understand market penetration and optimize plugin integrations. Lead users and early adopters on a platform can surface behavior shifts before they appear across the broader customer base. An ecommerce store running WooCommerce can compare its checkout behavior against platform-level benchmarks to identify whether its conversion issues are unique or systemic.
Enterprise analytics maturity: Among Fortune 1000 companies, virtually all use traditional web analytics tools. The competitive advantage comes not from the platform chosen but from how teams use segmentation, campaign measurement, and multi-app tracking. Companies with faster reporting cycles and stronger analytics teams convert insights into revenue sooner.
Market share dynamics: Google Analytics' share among sites with any analytics tool dropped from about 86% in 2021 to roughly 78% in 2026. Privacy-focused competitors have gained ground by offering cookieless tracking and server-side data pipelines, illustrating how privacy concerns reshape tool selection.
Common Web Analytics Applications
Ecommerce optimization: Online stores use funnel analysis to track the conversion process from product page to checkout confirmation. Purchase history data reveals cross-sell opportunities, and revenue metrics tie each user interaction to financial results. Increased revenue follows when friction points in the checkout flow are removed.
Content performance: Publishing sites track which articles generate engagement and which produce high bounce rates. The data informs editorial calendars, SEO strategy, and content investment. Valuable insights come from comparing session duration and scroll depth across content categories.
Campaign measurement: Marketers monitor referral sources, campaign parameters, click through rate, and cost per acquisition. This lets them allocate budget to the channels that produce results. Traffic sources categorize visitors so you can compare organic search against paid ads against social media against direct traffic.
User experience research: Path analysis shows how users navigate menus and where confusion arises. The user interface plays a critical role in whether visitors can complete tasks without confusion. User feedback combined with behavioral data creates a holistic approach to redesign; sentiment analysis of survey responses paired with navigation paths tells a fuller story than either data source alone.
Cross-platform tracking: Mobile apps track installs, in-app events, and retention cohorts. Cross-device tracking ties together visits from different devices into a single user journey, so businesses understand how users move between phone and desktop before converting. User behavior analytics tracks interactions on websites and apps across these touchpoints.
Frequently Asked Questions About Web Analytics
How much does web analytics cost and what tools should I use?
Google Analytics 4 is free and covers the needs of most small and mid-sized businesses. Adobe Analytics, which offers more customizable segmentation and data governance control, can cost tens to hundreds of thousands of dollars per year for large enterprises. Internal costs include developer time for tracking setup, QA, and tag governance. The right tool depends on your site's traffic volume, the complexity of your business objectives, and whether you need integration with other technologies like data warehouses or BI platforms.
Data conversion between analytics tools and other systems is a practical consideration during migration. Data conversion enhances data usability and accessibility for stakeholders across the organization. Improved interoperability between systems is a key benefit of data conversion, and data conversion maintains data integrity and quality during transformation. When moving historical data from one format to another, or performing data ingestion into a data warehouse, understanding the target format and ensuring compatibility across multiple formats matters.
How long does it take to see results from web analytics?
Data collection begins immediately after tracking code installation. For sites with fewer than 1,000 daily visitors, expect two to four weeks before you have enough data for statistically reliable conclusions. High-traffic sites can run A/B tests and draw informed decisions within days. The timeline depends on traffic volume, the number of changes you test, and how quickly your team acts on findings. Retention analysis, which measures how often users return to a product, requires at least 30 to 90 days of data to show meaningful patterns.
What privacy regulations affect web analytics and how do I comply?
GDPR requires a lawful basis for collecting user data (usually consent), purpose limitation, data minimization, and the right to access and delete personal data. CCPA requires transparency and gives California residents the right to opt out of data sale. User privacy is not optional; analytics platforms offer IP anonymization, consent controls, and data processing terms to help businesses comply.
Privacy concerns affect data accuracy. Browser tracking prevention and ad blockers interfere with client-side data collection, causing some metrics to undercount true traffic. Server-side tracking reduces this data loss but costs more to implement and maintain. Research shows many websites still fail to comply with consent requirements or bypass user consent entirely.
Discuss a Measurement and Reporting Framework With Masterly Tech Group
Your web analytics should help you understand what is happening on your website and why it matters to the business.
Discuss your website metrics, traffic analysis, conversion data, acquisition channels, user behavior, and marketing measurement needs with Masterly Tech.
Call (888) 209-4055 to discuss a measurement and reporting framework with Masterly Tech Group.